 FAO Map Catalog
FAO-UN Land and Water Division
Type of resources
Available actions
Topics
Keywords
Contact for the resource
Provided by
Years
Formats
Representation types
Update frequencies
status
Scale
Resolution
-

Grids with monthly values of coefficient of variation of precipitation for the period 1961-1990, at 5 arc min. Based on: New, M., Lister, D., Hulme, M. and Makin, I., 2002: A high-resolution data set of surface climate over global land areas. Climate Research 21:1-25
-
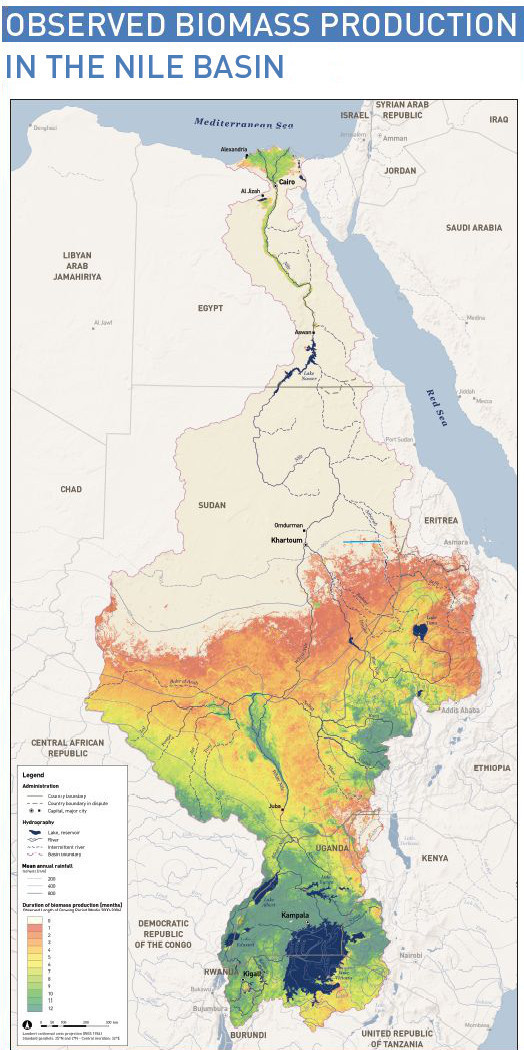
This map shows the spatial distribution of observed biomass production in the Nile Basin. It also relates annual biomass production to the irrigation volumes withdrawn from the Nile and to total annual rainfall. Biomass production is calculated monthly using the Normalized Difference Vegetation Index (NDVI). The base data are obtained from the orbiting MODIS Terra satellite sensor for the period 2000 to 2004. For all Nile countries annual rain volumes and biomass production are calculated and represented by proportional circles, which are drawn to the scale of the map. The green area represents total vegetation growth under rainfall while the blue area is the amount of biomass from stream flow. As can be observed, large parts of Egypt and the Sudan (the Sahara Desert) have no vegetation at all. On the other hand, the Lake Victoria region is covered with vegetation throughout the year, so is the Sudd in southern Sudan. This map clearly indicates where water is the main constraint to vegetation growth. It should be noted, however, that it does not consider the quality of the vegetation.
-
Grid with estimated precipitation per month with a spatial resolution of 10 arc minutes. This dataset has been constructed from 27 075 stations with 1961-1990 climatological normals. The dataset consists of 12 ASCII-grids with mean monthly data in mm/day * 10, and one ASCII-grid with yearly data in mm/year. In addition, 12 ASCII-grid with monthly values at 5 arc minutes resolution are made available as input data for a global water balance model (GlobWat).
-
Geo-referenced point database on dams in Southern Eastern Asia.
-
Geo-referenced point database on dams in the Middle East.
-
Geo-referenced point database on dams in Africa.
-
Irrigation cropping pattern zones in Africa which are considered to be homogeneous with respect to crop calendar and cropping intensity. The delineation of the irrigation cropping pattern zones was done by compiling information of various types: distribution of irrigated crops, average rainfall trends and patterns, topographic gradients, presence of large river valleys (Nile, Niger, Senegal), presence of extensive wetlands (the Sudd in Sudan), population pressure, technological differences and crop calendar above and below the equator. The dataset consists of the following information: - GIS generated codes (FID, ID); - a code with an unique number to identify the cropping pattern zone (PATRN_CODE); - a code with the name of the cropping pattern zone (PATRN_NAME); - the cropping pattern, crop calendar and monthly and yearly cropping intensities for the different zones are described in the on-line link below (Table 1). The map with irrigation cropping pattern zones is based on the FAO publication on Irrigation potential in Africa - FAO, 1997. Irrigation potential in Africa - A basin approach. FAO Land and Water Bulletin. Rome 177 p.
-
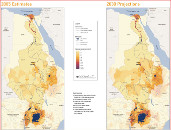
The population prospects in the Nile Basin present two maps of human population distribution in the Nile countries: an estimate for 2005, and a projection for 2030. Landscan 2004 provided the geo-referenced base layer. It was combined with the medium demographic growth variant for 2030, obtained for each Nile country from UNDESA. The maps show the high population densities in the Lake Victoria region, the Nile delta and valley, the Ethiopian highlands, and around Khartoum. Outside the Nile valley, large areas of the Democratic Republic of the Congo, Eritrea, Kenya, the Sudan and the United Republic of Tanzania are sparsely populated. It also shown that the settlement pattern in the lower riparians follows the Nile, while in the upper riparians it tends to follow – broadly – rainfall distribution. Data Sources in details: - United Nations Population Division (UNDESA), 2030 medium variant; - US Bureau of Census, 2005; - LandScan 2004 Distributed Population layer; - AFRICOVER urban areas; - ESRI Gazetteer; - Urban polygons digitized by the project for DR Congo, Egypt and Ethiopia.
-
Geo-referenced point database on dams in Central Asia.
-
This map shows the extent of land area equipped for irrigation -expressed as percentage- around the turn of the 20th century according to the Global Map of Irrigation Areas (version 4.0.1), together with areas of rainfed agriculture. Data are available from AQUASTAT - programme of the Land and Water Division of the Food and Agriculture Organization of the United Nations.